Blog
How We Calculate Costs & Savings: Our 2026 Methodology
How Home Energy Decisions builds its cost ranges and savings estimates: the DOE, EIA, NREL and ENERGY STAR data behind every number, the math, and where it can be wrong.
When you are weighing a big home upgrade, the question underneath all the others is simple: if I spend this much, how much do I save, and when does it pay off? Our tools exist to give you an honest, order-of-magnitude answer. This page explains exactly how those numbers are built, which public data feeds them, and where they can be wrong, so you can use them with judgment instead of treating them as a black box.
I have spent most of my career on the unglamorous side of this: building cost-and-savings models for utility energy-efficiency programs, where every claimed kilowatt-hour gets audited and a sloppy assumption shows up as a missed savings target. That background shapes how this site works. We would rather show you a wide, defensible range than a precise number we cannot stand behind. Below is the full method, the sources, the worked math, and the things we deliberately do not do.
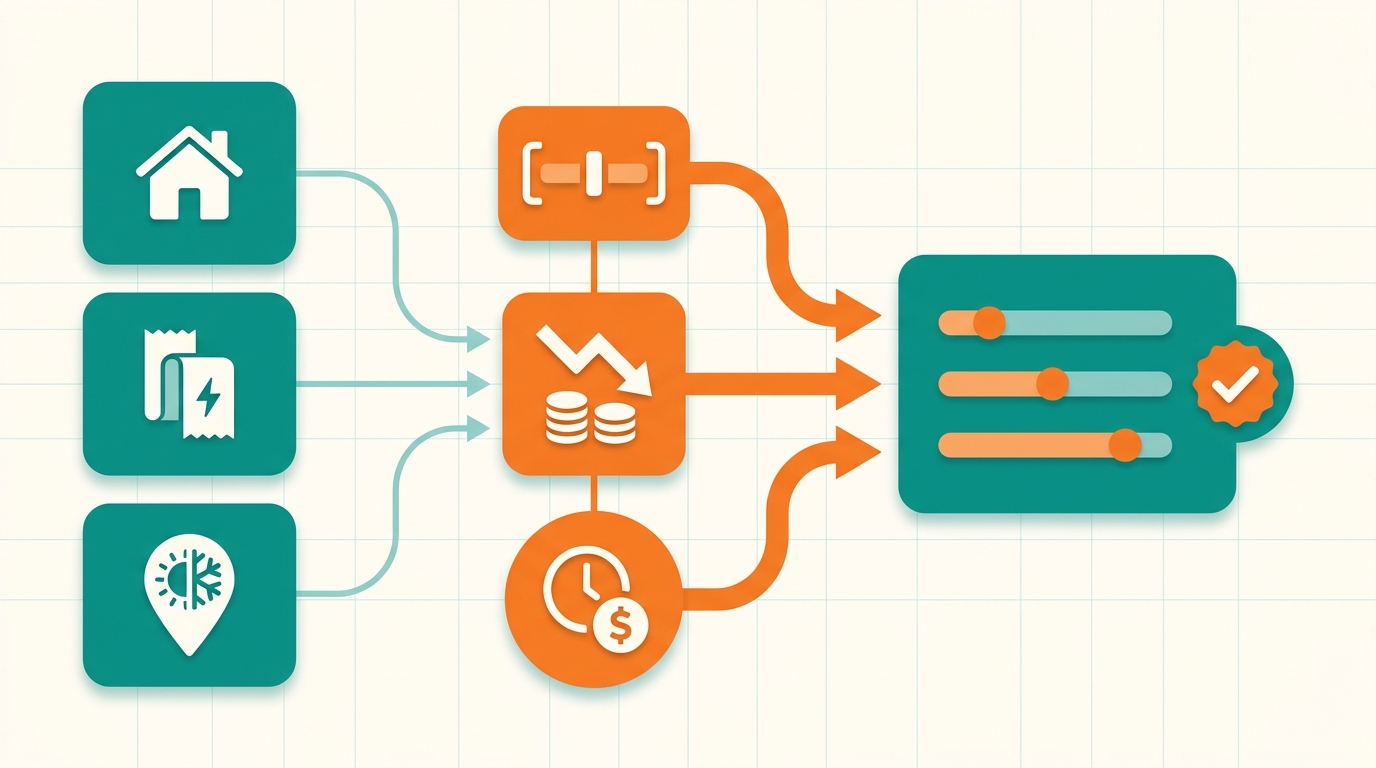
4 inputs
What drives the math
Home details, bills, energy rates, climate
~15%
ENERGY STAR shell savings
Heating & cooling, air seal + insulate
Low–Typ–High
Every cost shown as a band
Regional spread, not one figure
$0
Paid by contractors to alter results
The numbers are independent
The method below powers every calculator on the site. If you would rather see it in action than read about it, start with My Plan, which ties your bills, home details, and shortlist into one ranked view. The rest of this page is the engine under that hood.
On this page
- What our numbers are for, and what they are not
- The data sources behind every estimate
- The four inputs that drive the math
- 1. Your bills
- 2. Energy prices
- 3. Climate and seasons
- 4. Equipment performance and cost
- How we estimate where your money goes now
- How we estimate savings, upgrade by upgrade
- Insulation and air sealing
- Heating and cooling equipment
- Water heating
- Thermostats and smaller loads
- Solar
- The money metrics we show
- A worked mini-example, end to end
- Where our estimates can be wrong
- How often we update the figures
- How to use these numbers in a real decision
- Frequently asked questions
- Next steps
What our numbers are for, and what they are not
Our estimates are a planning and comparison layer. They are built to do three jobs well:
- Compare upgrades on the same footing, for example attic insulation versus a heat pump versus solar.
- Show realistic payback ranges instead of a single optimistic figure.
- Give you a defensible starting point for conversations with contractors, advisors, and the people you live with.
They are not built to guarantee a specific bill in year three, to replace an engineering load calculation, or to override hard constraints like budget, comfort, or health. If a contractor's quote differs from our estimate, treat the gap as a prompt to ask sharper questions, not as proof that either side is wrong.
Field note: why I distrust single numbers
Early in my utility-program days I watched a rebate program promise homeowners a flat "save $300 a year" on a measure. The engineering average was real, but half the participants saved nothing close to it because their houses, rate plans, and habits were nothing like the average. The complaints were brutal, and fair. Ever since, I have built models that lead with a range and force the question "what about your house is different?" That is why you will never see a lone, confident number from us where a band belongs.
The data sources behind every estimate
There is no proprietary black box here. Three layers of public data do the work, and we cite them so you can check us.
| Layer | What it sets | Primary sources |
|---|---|---|
| Engineering baseline | How energy is used and how efficient equipment is | DOE energy.gov / Energy Saver, U.S. EIA (RECS, electricity prices), NREL, ENERGY STAR |
| Dollar ranges | Installed cost low/typical/high | HomeGuide and Angi 2026 cost tables, utility and state program data, regional contractor pricing |
| Tax and incentive math | Credits and rebates | IRS (25C, 25D) and state/utility program rules |
The engineering layer is what keeps savings honest. EIA's Residential Energy Consumption Survey (RECS) tells us how heating, cooling, water heating, and plug loads typically split. EIA's price series tells us what a kilowatt-hour or a therm costs in your region. DOE and ENERGY STAR publish the efficiency ratios and savings averages we apply. NREL's solar production modeling anchors photovoltaic estimates.
The dollar layer is deliberately marketplace-based. National cost aggregators like HomeGuide and Angi survey thousands of real jobs, which is exactly the spread we want to capture. We treat their figures as bands, cross-check against utility program cost data, and never present a marketplace midpoint as if it were a quote for your specific house.
Independence, stated plainly
No contractor, manufacturer, lead-generation network, or utility pays us to change a cost range, inflate a savings figure, or move a project up your results list. We do not sell your inputs as leads. The whole reason a methodology page exists is so you can verify that claim against the actual sources we use.
The four inputs that drive the math
Almost everything flows from a short list of inputs. The more of these you provide from your own home, the better the output.
1. Your bills
Your past energy use is the best window into how your home actually behaves. We ask for up to twelve months of electricity use in kWh, twelve months of any gas, oil, or propane use, and your total annual spend on each fuel. That gives us both how much energy you use and what you pay per unit. For context, EIA puts the average U.S. household at roughly 10,500 kWh of electricity per year, but you do not need to match that average. We only need enough history to anchor the math to your reality.
2. Energy prices
We price each unit of energy in priority order. First choice is your own bill: total cost divided by total use over twelve months gives cents per kWh, dollars per therm, or dollars per gallon. If your bill is not handy, we fall back to local averages, such as EIA's residential electricity price by state. When we use a default, we say so, and you can edit it. As of early 2026, the U.S. average residential electricity price is around 17.6 cents per kWh, with states ranging from under 12 cents to over 40 cents. That spread is precisely why a bill-first approach matters.
3. Climate and seasons
How much you spend on temperature control depends on where you live. We pull in regional climate data: typical heating and cooling degree days, whether your region is heating-dominated, cooling-dominated, or mixed, and the length of each season. This tells us how much of your annual use goes to space conditioning versus year-round loads. RECS end-use breakdowns give us the regional starting pattern, which we then bend to fit your bills.
4. Equipment performance and cost
For each upgrade we need two things: how efficiently the new equipment turns energy into comfort, and a rough installed-cost band. Efficiency comes from standardized ratings (SEER2 and HSPF2 for heat pumps and AC, AFUE for furnaces, UEF for water heaters) and from ENERGY STAR and manufacturer documentation. Cost bands come from the marketplace and utility-program data described above. Those bands are wide on purpose, and we push you to replace them with your own quotes the moment you have them.
How we estimate where your money goes now
Before touching any upgrade, we build a picture of your current spend. It runs in three passes.
First, we sum your last twelve months of use and cost per fuel, convert to annual totals, and compute an average price per unit. A simple example: 10,000 kWh per year at 18 cents is $1,800 on electricity; 600 therms at $1.20 is $720 on gas, for roughly $2,520 a year on energy.
Second, we split that total by end use (space heating, cooling, water heating, everything else) by applying RECS and DOE shares for homes like yours, scaled to your annual total. Third, we adjust those shares to your actual monthly pattern. If your winter gas use runs double the regional norm while your electricity tracks it, we push more of your gas spend into space heating than the generic split would.
At the end, we can say something concrete: out of that $2,520 a year, roughly $1,050 goes to space heating, $400 to cooling, $450 to water heating, and $620 to everything else. That breakdown is the backbone for every savings estimate that follows. You can see this end-use split for your own home in the Bill Breakdown tool.
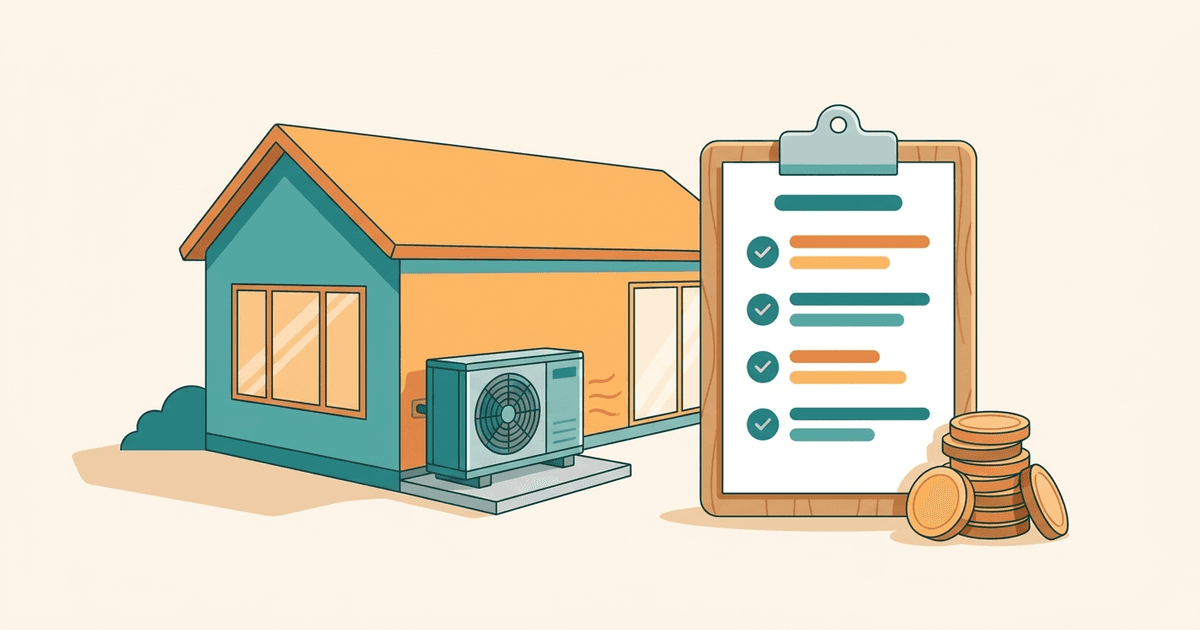
A professional audit, like the whole-house walkthrough above, measures these splits directly with a blower-door and infrared camera. Our tools estimate them from your bills and public data. That difference is exactly why we tell you the model is a starting point, not a substitute for an on-site energy audit.
How we estimate savings, upgrade by upgrade
Every upgrade uses the same backbone formula:
Annual savings = current spend on that load x expected percent reduction x your energy price
What changes between upgrades is how we estimate the reduction.
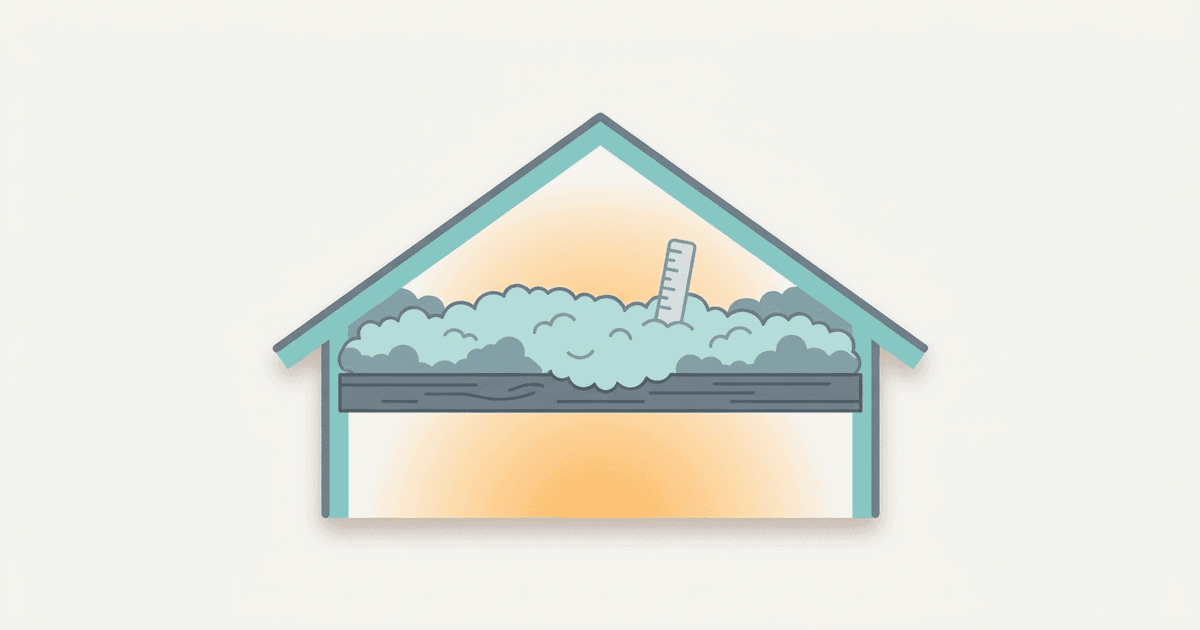
Insulation and air sealing
For shell work we lean on a well-documented field average. The EPA, through ENERGY STAR, estimates that air sealing plus added insulation in attics, floors over crawl spaces, and basements saves an average of about 15 percent on heating and cooling costs, or roughly 11 percent of total energy costs, in typical existing homes. We treat 15 percent as the central case for an older, leaky home getting a comprehensive package, then build a range around it: about 10 percent conservative, 15 percent typical, 20 percent or more for very leaky homes with strong scopes. If your breakdown shows $1,450 a year on heating and cooling, a 15 percent cut is about $220 saved. You can pressure-test that against your own attic in the attic insulation calculator.
Heating and cooling equipment
For furnaces, AC, and heat pumps we work from efficiency ratios and your climate. The core move is:
New annual energy for that load = old energy use x (old efficiency / new efficiency)
Then we convert back to dollars at your fuel prices. For a gas-furnace-to-heat-pump switch, we estimate annual heat demand, price the "before" with your furnace AFUE and gas rate, price the "after" with a seasonal heat-pump efficiency and your electricity rate, and adjust for cold-climate operation. DOE notes heat pumps can deliver the same heating or cooling for a fraction of the input energy, but the bill impact still hinges on your local electric-to-gas price ratio. We flag clearly when a heat pump improves efficiency yet may not cut the bill in a high-electricity-price region. Run your own case in the Heat Pump Calculator.
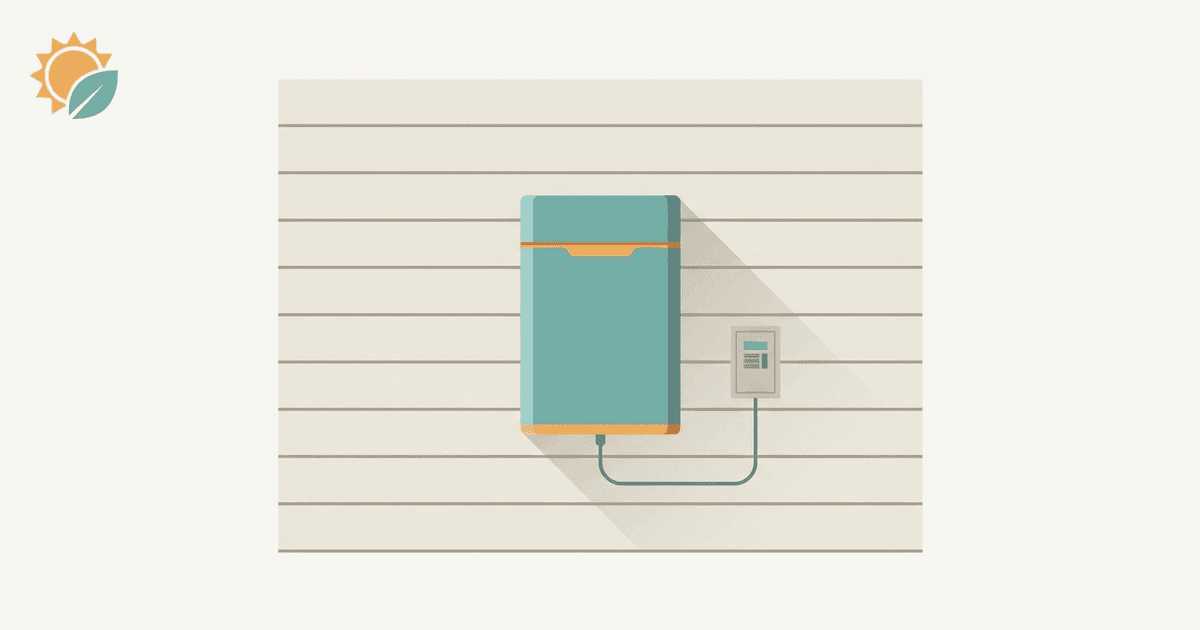
Water heating
DOE's Energy Saver materials explain that heat pump water heaters move heat rather than generate it and can be two to three times more efficient than conventional electric resistance tanks. We apply that ratio carefully. If you use 2,000 kWh a year for hot water and move to a heat pump unit using about a third of the electricity, annual use drops to roughly 650 to 700 kWh, and the difference times your rate is your savings. We cap results to the bill reductions utilities and state programs actually report, often a couple hundred dollars a year for a typical household. Compare unit types in the Tankless vs Tank Water Heater Calculator.
Thermostats and smaller loads
For setback thermostats and plug loads we use typical wattage, runtime, and ENERGY STAR product data rather than whole-home modeling. These support checklist-level decisions: whether the old garage fridge is worth keeping, what a smart thermostat schedule is worth, not the backbone of a 20-year financial model. The Programmable Thermostat Savings Calculator handles that case.
Solar
Solar takes more inputs, so our defaults stay conservative. We use typical annual production per kW for your region (commonly 1,100 to 1,600 kWh per kW across the U.S., per NREL modeling), your roof size and basic shading, your electricity price, and a net-metering or export-credit assumption based on current local policy:
Annual value = system size (kW) x annual kWh per kW x value per kWh
We then adjust the value per kWh for whether exports earn full retail credit or a lower rate. Solar policy and tariffs change fast, so we lean cautious rather than promise a payback that one rate update could erase.
The money metrics we show
Once we have annual savings, we combine them with project cost.
We start from your entered quotes if you have them, otherwise the marketplace and program cost bands. We always nudge you to replace defaults with real quotes, because cost swings more than savings.
For net cost, we subtract tax credits and rebates that genuinely apply, and we treat them as one-time reductions to project cost, never as recurring savings. This is also where 2026 policy matters: the federal 25C Energy Efficient Home Improvement Credit and the 25D Residential Clean Energy Credit both expired for projects placed in service after December 31, 2025. Our 2026 net-cost math reflects their absence unless you tell us about a state or utility incentive you plan to claim.
The headline measure is simple payback:
Simple payback (years) = net project cost / annual bill savings
A $4,000 project after incentives that saves $400 a year pays back in 10 years. This deliberately ignores energy-price inflation, maintenance, and equipment lifetime. It is crude on purpose, so projects compare on equal footing.
Where it helps, we also show 10- and 20-year savings at today's prices and a rough return range for projects with steady savings and a known lifetime. We do not assume aggressive price growth. By default we hold prices flat in real terms or apply a gentle escalation near the long-run EIA trend, where residential electricity has risen a couple of percent a year above inflation with large year-to-year swings. You can raise or lower that if you have a strong local view.
What we will not do with payback math
We will not bury a long payback under an optimistic discount rate, assume runaway energy-price inflation to flatter a result, or count a one-time rebate as if it repeated every year. Those tricks make almost any project look good on a slide. If a project only pencils out with heroic assumptions, the honest answer is that it does not pencil out, and we would rather tell you that.
A worked mini-example, end to end
To make the abstract concrete, here is the full path for one household considering attic insulation and air sealing.
| Step | Input or calculation | Result |
|---|---|---|
| 1. Annual energy spend | 10,000 kWh at $0.18 + 600 therms at $1.20 | $2,520/yr |
| 2. End-use split (RECS + bills) | Apply regional shares, adjust to winter spike | ~$1,450/yr on heating + cooling |
| 3. Expected reduction | ENERGY STAR shell-work range (10/15/20%) | $145 / $218 / $290 per year |
| 4. Project cost band | HomeGuide/Angi 2026, air seal + blown-in | ~$2,500–$5,500 |
| 5. Incentives (2026) | Federal 25C expired after 12/31/2025 | $0 federal unless state/utility rebate |
| 6. Simple payback (typical) | $3,500 net / $218 savings | ~16 years |
That 16-year payback is honest, and it is also why we never lead with payback alone for shell work. Insulation and air sealing earn their keep on comfort, quieter rooms, fewer drafts, and a smaller, cheaper heating system later, which a payback number cannot capture. The model surfaces all of that side by side so you are not deciding on one metric.
Where our estimates can be wrong
Any estimate can miss in both directions. Here is where, and why.
Your behavior changes. Install a high-efficiency heat pump, then start heating rooms you used to leave cold, and your comfort rises while your savings shrink. We cannot see your future thermostat choices, so we assume your comfort level holds roughly steady.
Install quality varies. A blower-door-guided air-sealing job and a quick "blow some insulation up there" visit do not deliver the same result. A heat pump sized with a proper load calculation beats one sized by rule of thumb. We assume competent installation following manufacturer guidance; poor work means lower savings.
Houses have quirks. Hidden moisture, knob-and-tube wiring that limits insulation, undersized ducts, or a shell that behaves nothing like the modeled average. An audit and a good contractor catch many of these. Our tools cannot see them all.
Rate structures and policy shift. If your utility uses time-of-use rates, demand charges, or seasonal bands, then when you use energy matters as much as how much. We model your average price per unit, which hides that detail; if your plan punishes evening use, have an advisor pressure-test any upgrade that shifts your load. And we do not bake in speculative policy. Our numbers reflect the public rules in force when we last updated the model, which is what the lastUpdated date tells you.
How often we update the figures
A methodology page is only as trustworthy as its freshness. Our cadence:
- Energy prices: checked against EIA at least twice a year, and after any large market move.
- Cost ranges: reviewed against current HomeGuide and Angi tables and utility program data at least annually.
- Tax credits and policy: updated whenever the law changes, which is why this revision reflects the 25C and 25D expirations at the end of 2025.
- Efficiency assumptions: refreshed when DOE, ENERGY STAR, or NREL publish new guidance or standards take effect.
The date at the top of every tool and article tells you when its underlying numbers were last touched.
How to use these numbers in a real decision
The safest way to use our estimates is as decision tools, not verdicts. Use them to rank projects ("if I have $5,000 this year, which two or three upgrades give the strongest long-term value?"), to frame questions for contractors ("your quote assumes 40 percent savings, but the data I see suggests 15 to 25 percent, what is different about my house?"), and to explain tradeoffs to the people you live with.
After a project, compare your before-and-after bills, weather-normalized where you can, against the estimated range. If they line up, your trust in the next estimate grows. If they do not, adjust your inputs and expectations. Good planning does not need a perfect forecast. It needs numbers that come from real data, own up to their limits, and let you swap in your own as you go. That is what we built these to do.
For the bigger picture, see how to plan home energy upgrades in sequence, how to match work to your budget in energy upgrades by budget, and when each upgrade makes sense in the Upgrade Timing tool.
Frequently asked questions
Where does your cost data come from? Three layers: government and lab data (DOE, EIA, NREL, ENERGY STAR) for the engineering, marketplace tables (HomeGuide, Angi 2026) plus utility programs for the dollar ranges, and IRS guidance for tax math. We show a low-typical-high band, not one number.
How accurate are the estimates? Order-of-magnitude. Cost ranges are usually within plus or minus 20 to 30 percent of a real bid for a standard job; savings are looser because they depend on behavior, install quality, and rate plan. Replace our defaults with your own bills and quotes for the best accuracy.
Do contractors pay you to change the numbers? No. No contractor, manufacturer, or utility pays to influence a cost range, a savings figure, or your results ranking. The numbers come from public data, not from anyone who profits when you buy.
Why is your range different from a quote I got? A quote prices your exact house on one day; our range is the regional spread for that job. Inside our band is normal. Far above the high end, ask what is different (access, contamination, premium gear). Far below, confirm the scope is complete.
Is this a substitute for an audit or quote? No. The estimates help you decide what to investigate. A blower-door-and-infrared audit and a contractor site visit catch house-specific issues the model cannot see. Use our numbers to plan, then get a real audit and quotes before committing.
Next steps
- Anchor the math to your home. Enter your bills and home details in the Bill Breakdown tool so the model uses your reality, not national averages.
- Compare candidate upgrades. Run the Attic Insulation Calculator, Heat Pump Calculator, and Tankless vs Tank Water Heater Calculator tools, then sequence them with Upgrade Timing.
- Build the plan. Pull it all together in My Plan, then read plan home energy upgrades to put the projects in the right order.
Sources & further reading
- Use of Energy in Homes (RECS end-use shares) — U.S. Energy Information Administration
- How much electricity does an American home use? — U.S. Energy Information Administration
- Why Seal and Insulate? (15% / 11% savings) — ENERGY STAR / EPA
- Heat Pump Water Heaters (2–3x efficiency) — U.S. Department of Energy
- PVWatts Calculator (solar production modeling) — NREL
- Energy Efficient Home Improvement Credit (25C) — IRS
- Heating & Cooling Installation Cost Data (2026) — HomeGuide
Frequently asked questions
Where does your cost data come from?+
We blend three sources into every cost range. Government and lab data set the technical baseline: DOE energy.gov, U.S. EIA energy prices, NREL, and ENERGY STAR. Marketplace data sets the dollar ranges: HomeGuide and Angi 2026 cost tables, plus regional contractor and utility-program figures. IRS guidance sets the tax-credit math. We show a low, typical, and high band rather than one number because real quotes vary that much by region and house.
How accurate are your cost and savings estimates?+
Treat them as order-of-magnitude, not a quote. Cost ranges are usually accurate within plus or minus 20 to 30 percent of a real bid for a standard job; savings are looser because they depend on your behavior, install quality, and rate plan. ENERGY STAR's own air-sealing-and-insulation savings figure is an average of about 15 percent on heating and cooling, and individual homes land well above or below that. Always replace our defaults with your own quotes and bills as soon as you have them.
Do you take payment from contractors to change the numbers?+
No. No contractor, manufacturer, or utility pays to influence a cost range, a savings estimate, or where you rank in a result. The numbers come from public data and marketplace cost tables, not from anyone who profits when you buy. That independence is the entire point of the methodology page.
How often do you update the figures?+
Energy prices are refreshed against EIA data at least twice a year and after major moves. Cost ranges are reviewed against current HomeGuide and Angi tables at least annually. Tax-credit and policy figures are updated whenever the law changes, which is why this page reflects that the federal 25C and 25D credits expired for projects placed in service after December 31, 2025. The lastUpdated date at the top tells you when the model was last touched.
Why is your range different from a quote I got?+
A quote is one contractor pricing your exact house on a specific day; our range is the national-to-regional spread for that job. If your quote is inside our band, that is normal. If it sits far above the high end, ask what is different: contamination, difficult access, premium equipment, or padding. If it is far below, confirm the scope is complete. The gap is a question to ask, not proof anyone is wrong.
How do you estimate savings for an upgrade?+
Every upgrade uses the same backbone: annual savings equals the energy you currently spend on that load, times an expected percentage reduction, times your energy price. The reduction comes from efficiency ratios (AFUE, SEER2, HSPF2, UEF) or from field-study averages like ENERGY STAR's 15 percent for shell work. We then show a conservative-typical-aggressive range instead of a single figure.
How is payback calculated, and what does it leave out?+
Simple payback equals net project cost (after any incentives) divided by annual bill savings. A $4,000 project saving $400 a year pays back in 10 years. It deliberately ignores discount rates, maintenance, and equipment lifetime so you can compare projects on equal footing. For longer views we show 10- and 20-year savings at today's prices with at most a gentle EIA-based escalation, never aggressive price-growth assumptions.
Do your estimates account for tax credits and rebates?+
Yes, as one-time reductions to project cost, never as ongoing savings. We subtract federal credits when they apply and any state or utility rebate you tell us you will claim. The federal 25C and 25D credits ended for projects placed in service after December 31, 2025, so 2026 net costs reflect their absence unless your state or utility offers its own incentive.
Are your tools a substitute for a home energy audit or contractor quote?+
No. The estimates are a planning and comparison layer, not an engineering design. A professional audit with a blower-door and infrared scan, plus a contractor's site visit, will catch house-specific issues our models cannot see: hidden moisture, knob-and-tube wiring, undersized ducts. Use our numbers to decide what to investigate, then get a real audit and quotes before you commit.
Can I change the assumptions you use?+
Yes, and you should. Every default (energy price, current efficiency, project cost, escalation rate) is editable. The model is built so you can swap in your own bills and quotes; doing so is the single biggest accuracy improvement you can make. We flag clearly whenever a number is a default rather than something you entered.
Why do you show a range instead of one number?+
Because one number would be false precision. A heat pump install can run $4,000 in one market and $18,000 in another for legitimate reasons. A single figure hides that and sets you up for a nasty surprise. A low-typical-high band tells you where you probably land and how much room there is to negotiate or to be careful.
Try the companion tool
This post links to an interactive tool built for this topic. Open it to see numbers tailored to your home.
Open the toolGet practical energy tips
Join homeowners getting practical tips on cutting energy bills and staying comfortable.
Practical tips only. Unsubscribe anytime.
Read this next
Related guides selected by topic overlap and upgrade path.
Heat pump installation costs $6,000 to $18,000 in 2026, about $12,000 to $14,000 for a typical ducted home. See costs by size and type, and how to compare bids.
Tesla Powerwall 3 installed cost in 2026 is about $13,000 to $16,500 all-in (battery, Gateway, labor, permits). The 30% federal credit is gone. Full breakdown.

Air duct cleaning costs $300 to $700 for a typical home (about $35 per vent). Honest 2026 guide: what gets upcharged, and why most homes do not need it.
Attic insulation costs about $1,500 to $3,500 for a typical home, or $1.50 to $4 per sq ft. See 2026 prices by material, attic size, and tax credit.